From Alert to Closed Case Without Leaving sochub
How a threat goes from a SIEM or EDR detection to a contained, documented, closed incident inside one platform — and how to onboard those tools in an afternoon.
Count the tabs open on an analyst’s screen during a real incident. The SIEM console where the alert fired. The EDR console to look at the host. A threat-intel site for the hash. Slack, where the actual decisions get made. Jira, because someone has to ask IT for a password reset. And a doc, somewhere, where the timeline is supposed to be written down afterwards.
Every one of those tabs is a place where context gets lost. The IOC that was looked up but never recorded. The containment that happened at 14:12 but got written down as “around 2pm”. The Slack thread that held the whole investigation and is now unsearchable.
sochub is built so that the work happens in one place. It is not a SIEM and doesn’t try to be one: it collects no logs, searches no events, runs no detection rules. Your SIEM and EDR keep doing what they’re good at. What sochub does is take their output and give it a home where the whole incident, from the first alert to the closing report, lives together.
This post walks through that path, then shows how to onboard the tools that feed it.
Getting alerts in: two doors
Everything starts with an alert landing in the Alerts queue. There are two ways to get one there.
Push, via webhook. Any tool that can send an HTTP request can post to /api/v1/alerts/webhook. You create one key per source under Settings → Integrations, so Splunk gets its own key, your email security gets another. The key decides which organization the alert belongs to, so a leaked key can only ever write to its own organization. Ingestion is idempotent on the source and the external id: a sender that retries gets the existing alert back and never creates a duplicate or re-fires any automation.
Pull, via workflow templates. For tools with an API, sochub ships ready-made pull workflows under Workflows → Templates. The catalog covers CrowdStrike Falcon, SentinelOne, Microsoft 365 Defender, Microsoft Sentinel, Entra ID Protection, Okta, AWS GuardDuty and Security Hub, Wiz, Proofpoint TAP, GitHub security alerts, Google Workspace Alert Center, Cloudflare and Atlassian. Each runs on a schedule, reads from the last successful run so nothing is skipped after an outage, deduplicates on the vendor’s own id, and fails loudly on a 401 or 429 instead of silently returning nothing.
Either way, the result is the same object: a pending alert with a source, a severity, a title and the raw vendor payload attached.
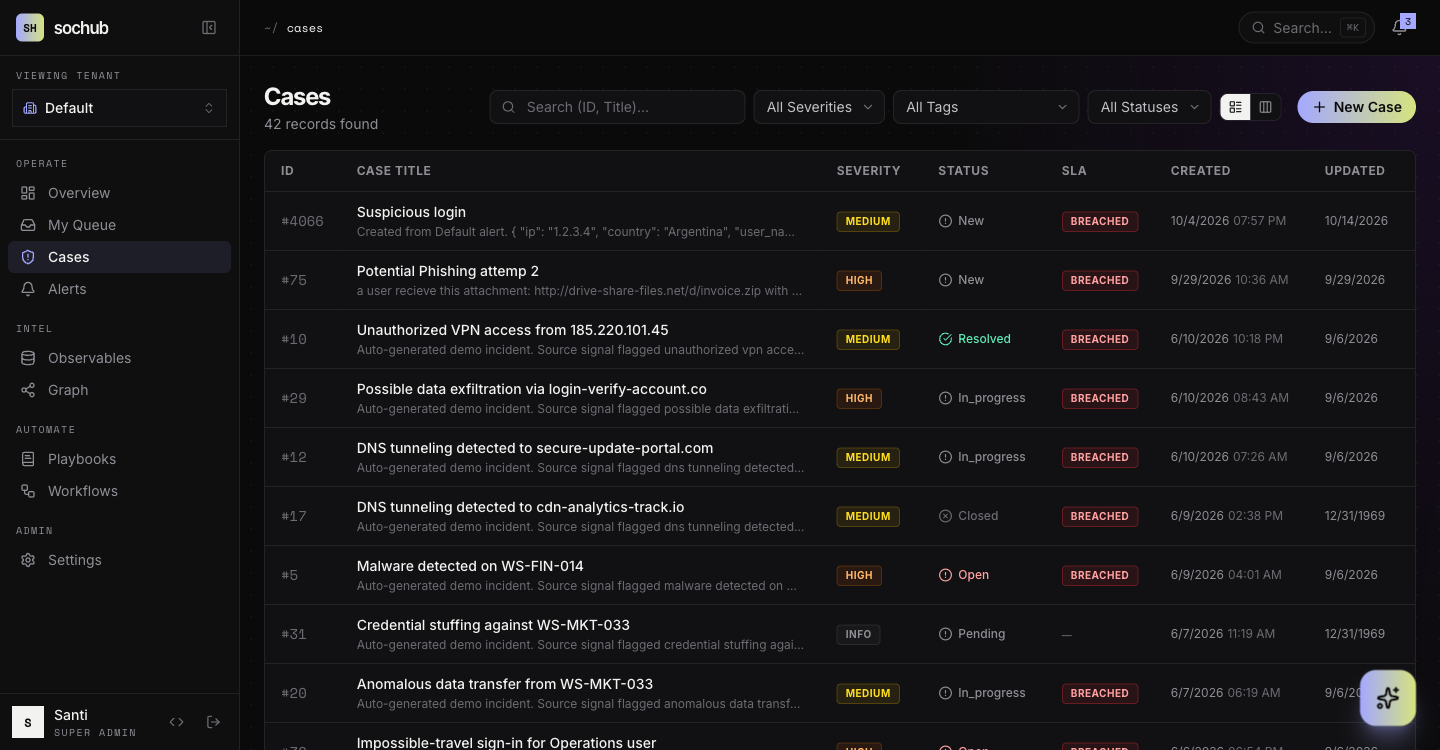
Triage without leaving the queue
The queue is where noise dies and real work starts. Filter by severity, source or status. Open an alert and sochub shows similar alerts that share indicators with it, so you see the five Falcon detections on the same host as one thing. Bulk-dismiss the rest, or promote one into a case.
Noise you already understand gets a suppression rule: a VPN egress range, an approved scanner, a service account that trips the same identity rule every Monday. Matching alerts are stored as dismissed with the rule attached, never dropped, and never start a workflow. Rules expire, show a preview of how many recent alerts they would have caught, and warn you when that is most of them.
Triage can also be automated. The EDR alerts to case template dismisses low and informational detections, groups the rest into one case per host, adds the hostname as an asset and applies a playbook. The identity templates group sign-in alerts by user. And for the alerts where the right answer is “just ask them”, the Was this you? workflows message the user on Slack or by email. It was me dismisses the alert with the answer as the reason. It wasn’t me, or an hour of silence, opens a high-severity case. Silence never closes an alert.
Working the case
A promoted alert becomes a case, and the case carries everything.
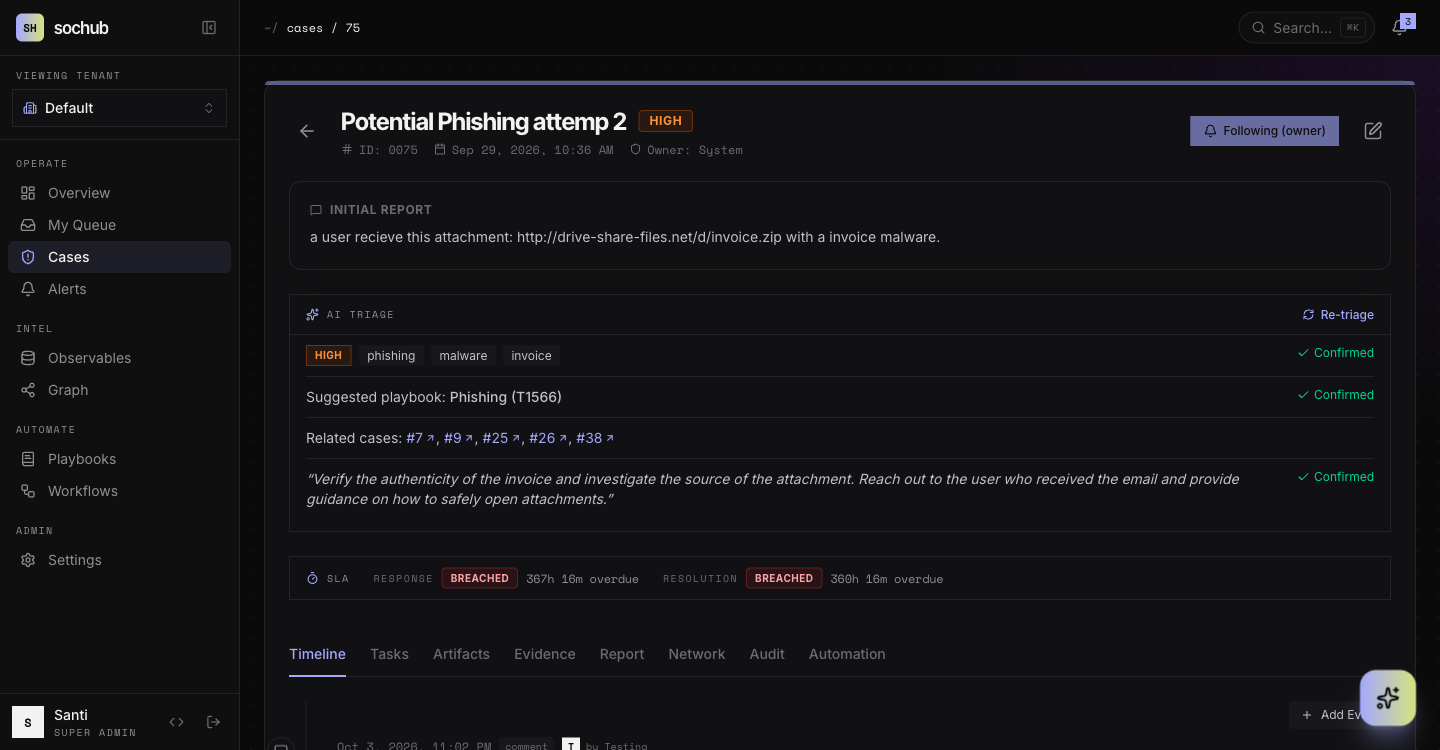
The Activity tab is one chronological feed: investigation events dated when they actually happened, each with an ATT&CK tactic, plus notes, mentions, containment results and system changes. The incident glance at the top puts milestones and status phases on one axis. First seen, Detected, Contained and Recovered are computed from case data until an analyst declares an exact time, and the same four values feed the time-to-detect, time-to-contain and time-to-recover numbers in the report. Nobody reconstructs a timeline from Slack afterwards, because it was being written as the work happened.
Artifacts and assets are separate on purpose. An artifact is evidence of the attacker: an IP, a domain, a hash. An asset is something of yours: a host, an account, a service, with its compromise status. Artifacts are enriched automatically against VirusTotal, URLhaus, ThreatFox, RDAP and crt.sh, gated by TLP so a red-tagged indicator is never sent to a third party without someone saying yes. When an artifact turns out to matter beyond this case, promote it to an IOC and it becomes visible across every investigation in the organization.

The Network tab draws the investigation graph two hops out from the case, which is how you find out that this week’s phishing domain resolved to the same IP as last month’s “resolved” case.
Tasks come from the playbook, grouped by phase: identification, containment, eradication, recovery, lessons learned. Assign a task to a person, or hand it to an outside team as a Jira, HaloPSA or ConnectWise ticket. The ticket belongs to the task, so when IT closes it, the task updates.

Responding from the case
This is the part that usually forces the trip back to the vendor console. The same template catalog that pulls alerts in also ships response workflows that run from a case with one click: contain a host in CrowdStrike Falcon, disconnect a SentinelOne agent, isolate or release a device in Microsoft Defender, suspend an Okta user and revoke their sessions, revoke Entra ID sign-in sessions, sign a Google Workspace user out, block an IP at Cloudflare.
Each one finds the target from the case itself, refuses to act when the match is ambiguous, writes the result as a case note, and ticks the task it was attached to. The Containment list on the case shows what was contained, refused or released, and the Activity feed stamps it with the real time. Credentials for all of this live in a secrets store bound to specific hosts, never in the workflow graph.
For the human side, each case can open a Slack war room, and workflows can ask a user to confirm a task before it proceeds.
The copilot does the typing
The investigation copilot sits on every page and, on a case, has the full case context. Paste an alert body and ask what matters. Ask it to “add a note: user confirmed the download came from a Teams message” and it records exactly that text, parsed from your message rather than paraphrased. Ask it to add the IP it just noticed as an artifact, and it proposes an action card you confirm before anything is written.

By default it runs on a local model, so case data stays in your environment. Tenant admins can switch to a hosted provider if their policy allows.
Closing, reporting, auditing
Closing a case asks for an outcome. The report is built from the case: milestones, the pinned events from the activity feed, artifacts, IOCs, tasks and containment, as a document you can hand to a manager or an auditor. The audit trail already has every state change with who made it, including actions taken by automations or through the MCP server, which show up as “via” that client.
If an outside party needs to see one case, invite them as a guest. They get that case and nothing else.
Onboarding a SIEM or EDR: the short version
- For a tool that pushes, create a webhook key in Settings → Integrations and point the tool’s alert action at the webhook URL. Make the external id unique per firing if you want every firing recorded.
- For a tool with an API, open Workflows → Templates, install the pull template for it, and fill in the parameters. It installs disabled.
- Add the secrets the install dialog lists under Settings → Integrations → Secrets, restricted to the vendor’s hosts.
- Open the workflow, press Dry run, read the output, then enable it.
- Install one triage template for that source, so alerts become cases on their own.
- Install the response templates you expect to need, and attach them to the matching playbook tasks.
The live demo at /demo/ shows the queue with pending alerts from Splunk Enterprise Security, Microsoft Sentinel, Elastic and Wazuh, if you want to see the starting point before setting up your own.
sochub is open source and self-hosted: github.com/sochub/soc-hub. The integration guides for each vendor, with the exact API scopes, are in the repository under docs/workflows/integrations.